I wrote this article for the Connect magazine and it was published in issue Connect 10/09, here I publish it with the kind permission of the editorial staff.
How to Monitor the Network Using SNMP and NetFlow
In the previous issue of Connect! magazine, we discussed the basic areas and principles of network monitoring. Today, we will describe in more detail two other important protocols: NetFlow and SNMP.
NetFlow - Data Flows in the Network
NetFlow, sFlow, IPFIX (IP Flow Information Export), and others are protocols and mechanisms designed for collecting data flows and sending them to another device for aggregation and analysis. Various protocols were created by different manufacturers of active network devices and are mostly proprietary. NetFlow, currently the most widely used, was created by Cisco and later was the basis for the IETF standard IPFIX.
The working principle is that in the network, we have one or more Observation Points, which are places where the traffic is monitored (usually one or more interfaces of a device). At this point, we monitor the traffic, perform filtering and aggregation, and create Flow Records about the flows. These records contain information about individual IP Flows (including the start and end time, input and output interfaces, number of bytes and packets in the flow, and header information).
Network flow is a unidirectional sequence of packets that pass through an Observation Point within a certain time interval and have the same basic packet properties (such as IP address, port, protocol).
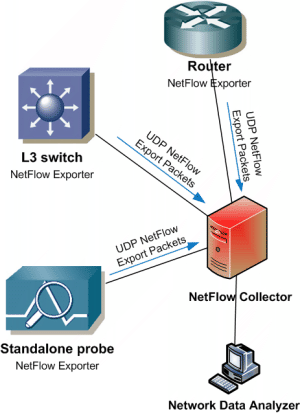
The device where the NetFlow service runs is called an Exporter (it can be a router, switch, or a standalone probe). It monitors packets, creates flow records for these packets, and sends this data in the form of Flow Records at regular intervals to a NetFlow Collector. Here, the data is processed and stored (in text files or a database). The Collector can receive data from multiple Exporters. Then, an application running on the database of records can perform analysis and visualization of the NetFlow data.

NetFlow support is primarily found on Cisco devices, starting from low-end routers like the 800 series, while on switches, it's available on higher-end models like the Catalyst 4500 and above.
By default, it collects information about routed traffic, and the exact data that is collected depends on the NetFlow version. The first version was 1. Today, the older versions 5 and 7 (a version 5 equivalent, but specifically for Catalyst 6500 and 7600) are still widely used. Version 8 added various aggregation schemes and reduced resource utilization. The latest version 9 is called Flexible NetFlow and has an extensible export format, so we can add additional monitored fields (used, for example, for MPLS, Multicast, BGP).
The use of NetFlow is suitable for several reasons. We can monitor the load on the network over time and plan for capacity expansion or better utilization of existing resources. At the same time, we can use NetFlow data for analyzing security threats, such as detecting Denial of Service (DoS) attacks.
Among the freely available NetFlow tools, the most widespread collector is Nfdump, which collects and processes data from the command line. We can build our own scripts on top of this data, which react to certain situations. Or we can use the graphical web-based overlay NfSen, which can display graphs with basic information.
To get the most out of NetFlow, we need a smart analyzer, as otherwise, it's just a large amount of data. Examples of specialized commercial solutions are Cisco MARS and NetFlow Tracker from FLUKE networks.
SNMP - Management Protocol
We can certainly say that the basis for the management (monitoring and configuration) of network devices is the SNMP (Simple Network Management Protocol) protocol. It is a series of standards (described in IETF RFCs) that first appeared in 1988 and is now widely used. SNMP support is not only found on servers and active network devices (such as switches and routers), but on almost every device that communicates over the network (printers, UPS, WiFi APs, firewalls, various network sensors, such as thermometers).
Using SNMP, we can read or set values on a device, or receive notifications about a defined event. We can retrieve values on demand or at regular intervals. Further processing depends on us (or the application used), whether we just display the value or draw a graph (e.g. temperature or CPU utilization over time) or perform a defined reaction.
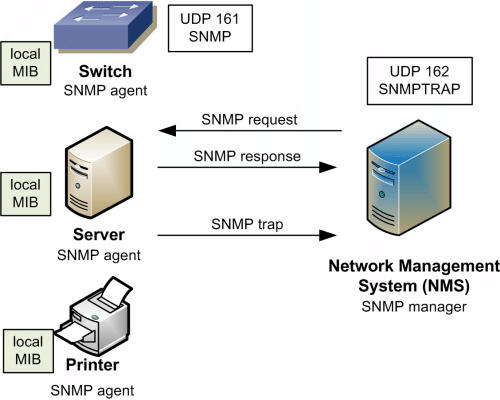
The SNMP protocol requires two parties for communication. One entity is the manager and the other is the agent. SNMP operates in two modes:
- The manager sends queries to the agent and receives responses - so values can be obtained by multiple managers and they can ask at any time
- The agent sends notifications (traps) to the manager's address - in some defined situations (exceeding a value or even at regular intervals), the agent sends values to one manager
Different SNMP Versions
Currently, there are three versions of the SNMP protocol. The initial SNMPv1 version has many shortcomings, so it's best to avoid it if possible. Then came SNMPv2, which existed in several variants, but today only SNMPv2c is used (and it is probably the most widespread version). The latest is SNMPv3, which is recommended from a security standpoint, but its use is somewhat more complex.
The information sent in SNMP packets is normally stored in plain text. To allow only authorized users to read or set the data from the devices, a form of authentication is used. For SNMPv1 and SNMPv2c, a community string is used, which is a text string, and it is transmitted in every packet as plain text. More precisely, two of these passwords are used: read community string, which allows read-only access, and write community string, which allows write access. SNMPv3 brings several security improvements, such as authentication using a username and password (User-based Security Model), protection against modification or disclosure (MD5 and SHA checksums and DES encryption of communication), and access control to individual objects (View Access Control Model).
The SNMP protocol can run not only over IP, but also over other protocols, such as OSI CLNS, AppleTalk DDP, or Novel IPX. In practice, however, we almost exclusively encounter IP networks, so for simplicity, we will only consider the TCP/IP version of SNMP.

SNMP uses the UDP protocol for communication, which is fast but does not have a delivery confirmation mechanism (which is present in TCP). SNMP from version 2 onwards includes its own delivery confirmation mechanism. Each SNMP message is encapsulated in a single UDP packet. When the manager sends a query to the client, the source port is dynamically chosen, and the destination is the default port 161 (on which the SNMP agent listens). The agent responds from port 161 to the dynamic port of the manager. Traps are sent by the agent from a dynamic port to the manager's port 162.
Delving into Communication
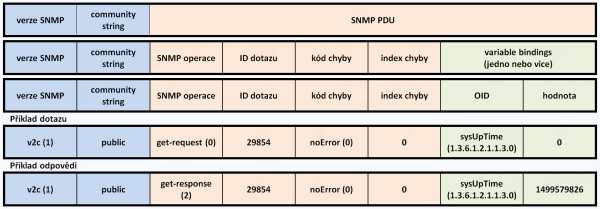
When we look more deeply into how SNMP communication works, it's very simple. SNMP has a precisely defined packet format, whose application part (layer 4 in the TCP/IP model) is schematically shown in the figure. Here, you can see a division into a header, which contains the SNMP version and community string identification, and user data, which is designated as the SNMP PDU (Protocol Data Unit). The data part consists of the SNMP operation designation, the request number for binding between the request and the response, a possible error code and a pointer to the object where the error occurred, and variable bindings, which is a binding of OID and the corresponding value. Since we can ask for multiple values at once, the variable bindings can occur multiple times in a row for different OIDs.
Inside the SNMP packet, data is stored using Basic Encoding Rules (BER), which simply means that each field is stored as a data type specification, length, and the actual data. Several types are defined, for example, sequence (code 0x30), Integer (2), OctetString (4), Null (5).

Let's describe an example of the SNMP GET operation communication. The standard communication goes like this: the SNMP packet is set with the type to get-request, the request ID, the OID value we want to read, and the actual value is set to NULL. This UDP packet is then sent to the agent.
The agent processes it and sends a response, where it sets the type to get-response, retains the request ID, and sets the read value for the OID.
SNMP has several defined operations:
- Get - to retrieve one or more instances of an object (in SNMPv1, if an error occurs for one value, nothing is returned, in SNMPv2 it already returns what was read without error)
- GetNext - returns the instance of the next object in the list or table
- Set - sets the value of an object instance
- Trap - asynchronously informs about an event
- GetBulk - new in SNMPv2, returns a larger block of data (like multiple rows from a table)
- Inform - new in SNMPv2, used for communication between two managers
In SNMPv1, the packet format is different for Trap than for the other operations. In the SNMPv2 version, the format was simplified and unified to the same format.
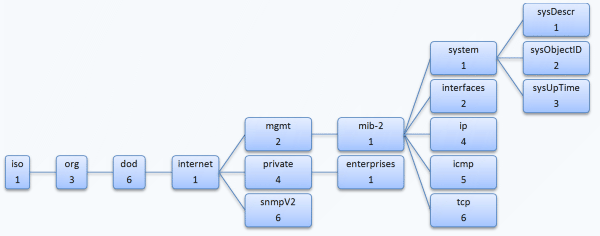
The managed objects, i.e., the values or properties that we can read or set using SNMP, are stored in a virtual information repository called the Management Information Base - MIB. The MIB structure is hierarchical and represents a tree. It starts with an unnamed root, and under it there are nodes, each of which can be the root of a subtree. Nodes have labels, which consist of a brief textual description and a number.
For the unambiguous identification of an object, the Object Identifier - OID is used, which is a sequence of integers separated by a dot. The OID reflects the hierarchical structure of the MIB, taking the OID of the parent node and adding its own number after the dot. An example of an OID for the MGMT subtree is .1.3.6.1.2. OIDs can also be written using the labels from the node labels, so MGMT can be written as .iso.org.dod.internet.mgmt.
Related data is stored in MIB modules, which together form the MIB database. MIB modules are stored as text files. The manager does not need to have the MIB DB available, but it can help, for example, in representing the values. The agent contains the MIB database, in which the objects it processes are defined.
MIB uses the notation according to SMI (Structure of Management Information), which is a subset of the ASN.1 (Abstract Syntax Notation One) standard. With SNMPv2, extended SMI was introduced, which adds several values. SMI is used to define the individual object types that we can use in SNMP.
MIB is divided into two main parts. The Standard MIB, defined by the IETF organization, describes universal properties that most manufacturers implement. And the Enterprise MIB, where the IANA organization assigns unique subtrees (OIDs) to individual companies, which they then manage themselves.

SNMP is simple, and therein lies its strength, even though the issue of security is often discussed today. There are many SNMP applications, and we can use it in many places in a variety of ways. The common factor is that the basic usage is very simple.
We can read or set values using scripts in the Windows, Linux, and other environments. Probably the most widespread for this purpose is the group of open-source command-line applications called Net-SNMP. It consists of a series of small applications that represent the individual SNMP operations at the basic level. An example of reading the UpTime from a network device is shown below. The return value is in the Timeticks format, so Net-SNMP also converts it to a more readable format.
c:\NetSNMP\bin>snmpget -v 2c -c public 192.168.100.21 .1.3.6.1.2.1.1.3.0

DISMAN-EVENT-MIB::sysUpTimeInstance = Timeticks: (1500335577) 173 days, 15:35:55.77
Another option is to create a simple or more complex program. We can manage with basic programming knowledge and create our own application, for example, in PHP or Java. A simple example in PHP and its output.
<?php echo snmpget("192.168.100.21", "okro", ".1.3.6.1.2.1.1.3.0"); ?>
When executed, the output is:
Timeticks: (1500372420) 173 days, 15:42:04.20
Most monitoring solutions use SNMP as one of the monitoring options. There are also single-purpose applications that read data from a specified OID and display it in a graph or table. For SNMP testing, there are a number of simple tools, such as the KS-Soft MIB Browser or the Paessler SNMP Tester.
Čáu
Máme ve firmě Catalysty 3560G a 3750G který,jak píšeš, nepodporují NetFlow...myslíš že by k jejich zprovoznění pomohl novější firmware ?
respond to [1]Coudu: Před časem jsem to hledal pro 3750ku. Prostě to u nich Cisco nepodporuje (nezáleží na verzi IOSu) a asi ani v budoucnu nebude. Je to skoro na všech routerech, ale u switchů až u velkých :-(.
respond to [2]Samuraj: Tak to je naprd teda :-( ..dík za info.
Svita se na lepsi casy. Ja to ted resim v siti a podporuji to uz 2960X, pravdepodobne cela rada X. Podle me mozna i rada S, ale pravdepodobne s IOS 15 :-)