Note: The description in the article is based on FortiAnalyzer VM version 6.2.3.
Documentation
- FortiAnalyzer 6.2
- VMWare ESXi VM Install Guide 6.2.0
- FortiAnalyzer 6.2.3 Administration Guide
- FortiAnalyzer 6.2.0 Cookbook
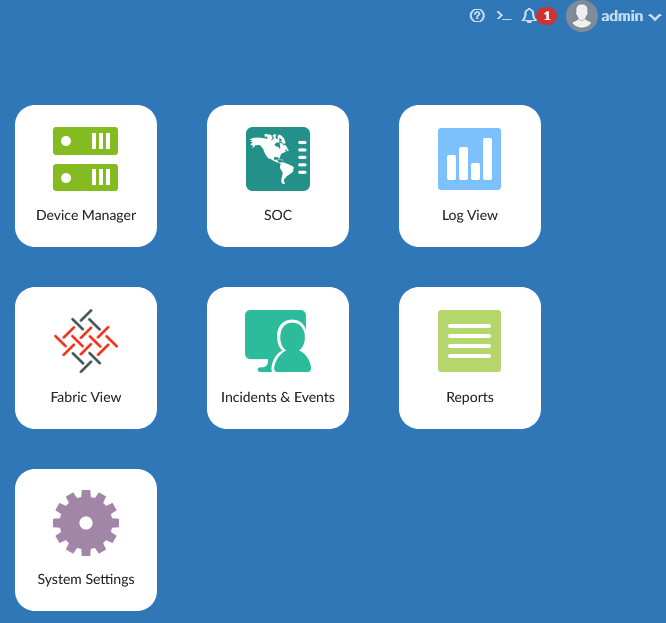
FortiAnalyzer VMware Installation
FortiAnalyzer is available as a VM (Virtual Machine) for various platforms (VMware vSphere, Citrix Xen Server, Xen, KVM, Microsoft Hyper-V, and other cloud services). It supports a maximum of 10,000 devices/VDOM and various amounts of daily logs (from 1 GB) and storage capacity (from 500 GB), which is handled through licensing. The minimum hardware requirements are 2 vCPU, 4 GB vRAM, and 1 vNIC, but the recommended minimum is 4 vCPU, 8 GB vRAM, and 1 vNIC.
The FortiAnalyzer Image can be downloaded from the Fortinet Customer Service & Support website, in the Download - VM Images section. There, we can select the product and platform. For VMWare ESXi, we download the zip file (FAZ_VM64-v6-build1235-FORTINET.out.ovf.zip), which contains the OVF template and disks. Without licensing, a 14-day trial is available.
Brief Initial VM Setup Procedure
- Create a virtual machine from the template (Deploy OVF Template and select all the files)
- Choose the storage and disk type, FortiAnalyzer requires a lot of space, so it might be suitable to use Thin Provision and possibly create a larger disk than currently planned (it's easier than future expansion)
- The image has 4 network adapters, set Network 1 (Network Adapter 1 = Port 1) to the management network, and the rest can be turned off
- We may be able to upgrade VM compatibility (maybe to VM version 13)
- Before starting the VM, we adjust the hardware parameters, vCPU, vRAM, vNIC, disks Hard Disk 1 is the system (do not change), Hard Disk 2 is for logs (we need to increase it)
- Start the VM
- Connect to the console, user admin with an empty password, set a new password
- In the CLI, set the network parameters so we can later connect to the web interface (HTTPS and SSH access are enabled by default)
We can list the network interfaces
diagnose fmnetwork interface list
Setting the IP address on port 1
config system interface
    edit port1
        set ip 192.168.0.10 255.255.255.0
end
Setting the gateway
config system route
    edit 1
        set device port1
        set gateway 192.168.0.1
end
Testing the communication
execute ping 192.168.0.10
License Registration
On the Fortinet Customer Service & Support website, under Register/Activate Contracts, we enter the Registration Code. We can also register the support at the same time. We enter a name for identification and must enter the IP address that one of the FortiAnalyzer interfaces has. If we have addon licenses, we first register all of them on the website, obtain a common license file, and then upload it to FortiAnalyzer.
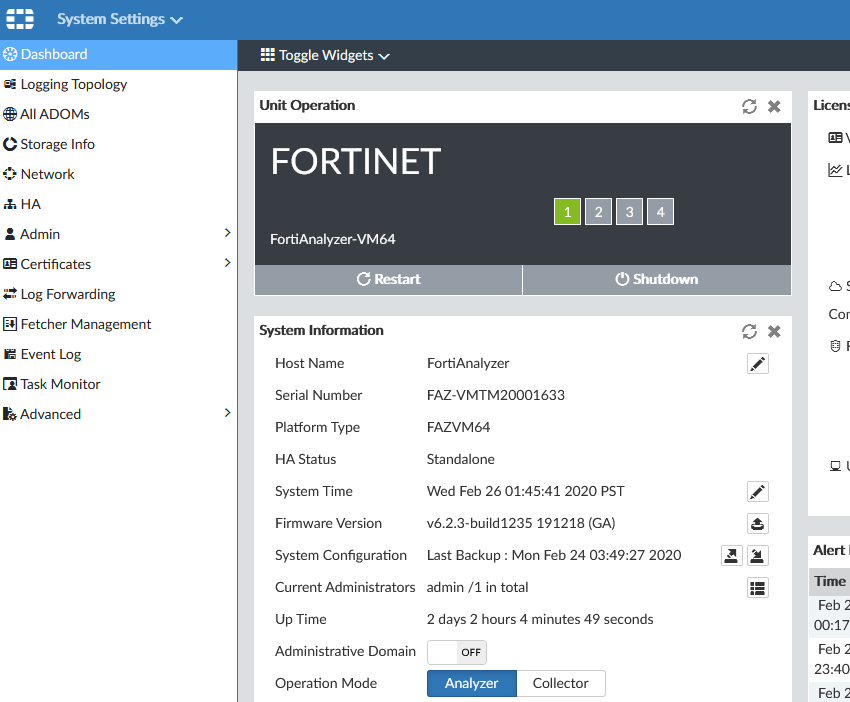
The license is uploaded through the CLI or GUI System Settings > Dashboard in the License Information section. After uploading the license, a restart is required.
Log Storage Principle and Configuration
All log data is stored on the FortiAnalyzer disk. The data is compressed and stored in the file system and for a certain period, it is also present in the SQL database. The data can be in one of three phases:
- Real-time log - just received and unprocessed items
- Analytics logs or historical logs - indexed items in the DB in online state, can be used for reports, Log View, SOC, Incidents & Events
- Archive logs - compressed logs on the disk in offline state
Compressed logs are received and stored in a log file on the disk. When the log file reaches the specified size (Device Log Settings), it is archived, and a new one is created. At the same time, the logs are stored in the database and indexed. These are online data, which are used for analysis.
The data is retained in the database for the specified time (Storage Info) and then deleted (it still remains in the log files on the disk). Offline archive data on the disk (it takes up significantly less space than the data in the DB) is again deleted after the specified time (Storage Info).
Viewing Logs
- Log View - viewing logs, by default displays Historical, but we can switch to Tools > Real-time Log
- Log View > Log Browse - can also view archived logs
- SOC - FortiView
Global File Deletion Settings
- System Settings > Advanced > File Management
We can set automatic deletion of logs, reports, archives, and quarantine files after a specified time. This setting always applies, even if we set a longer time in the log storage policy, the logs will still be deleted according to this global setting.
Log File Settings
- Settings > Advanced > Device Log Settings
We can set the size of the log files and forwarding to other devices.
Storage Usage Information and Policy Configuration
- System Settings > Storage Info
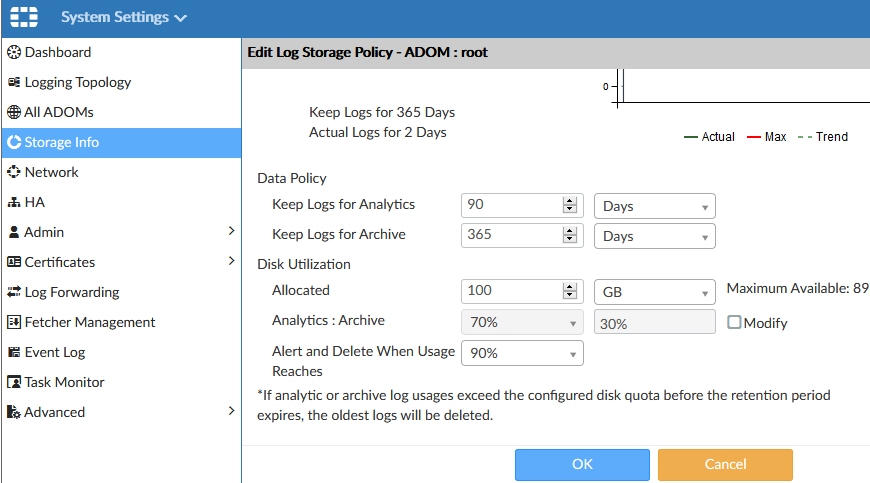
It shows information about the use of log storage. By editing the item, we can configure the Log Storage Policy. In the upper part, we see a graphical representation of the disk space usage for analytics data (online) and archive (offline). Clicking on the graph will take us to information about individual devices.
The lower part contains the policy settings that affect the logs and SQL database of the devices assigned to this policy. In the Data Policy section, we set how long the data should be retained. In the Disk Utilization section, we configure the disk usage:
- Allocated - how much of the available space should be used (the system reserves a certain part of the disk for its own use)
- Analytics : Archive - we determine the ratio of disk usage for online and offline data (the default is 70:30)
- Alert and Delete When Usage Reaches - an alert is sent, and the oldest data begins to be deleted at the specified disk usage
Basic Configuration
Dashboard
- System Settings > Dashboard
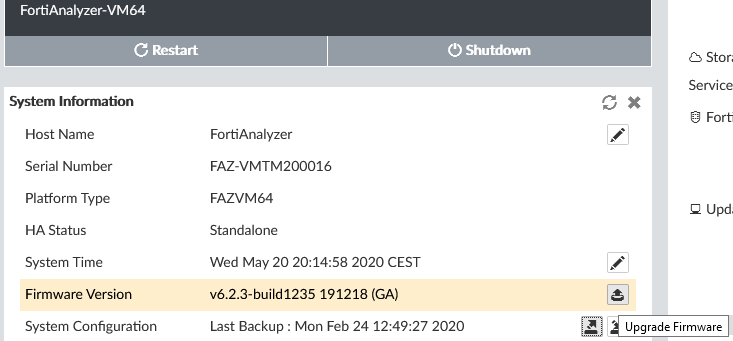
Various widgets with information, licenses, etc. In Unit Operation there is a restart and shutdown. In System Information, there is renaming the unit, system time, backup, and more.
Certificates
- System Settings > Certificates > Local Certificates
- System Settings > Certificates > CA Certificates
- System Settings > Admin > Admin Settings - HTTPS & Web Service Certificate
Administrative Domains
- System Settings > All ADOMs
Administrative Domains allow you to create domains, into which we group devices and assign administrators. This allows certain administrators access to selected devices. If we don't use ADOM, there is a root ADOM in the Security Fabric.
By editing the (Root) ADOM, we see the included devices and the Log Storage Policy settings.
Administrators
- System Settings > Admin > Administrators
Administrators can be authenticated locally (including by certificate) or against LDAP, RADIUS, TACACS+. The settings are similar to those on FortiGate. FortiAnalyzer 6.2.5 - Authentication
It is possible to set that members of an LDAP group are administrators. Technical Note: How to configure FortiAnalyzer administrators LDAP account using the wildcard setting
Network Settings
- System Settings > Network
We set addresses, DNS, and allow access for management.
Mail Server
- System Settings > Advanced > Mail Server
Connecting FortiGate to FortiAnalyzer
FortiGate Configuration
- Global - Log & Report - Log Settings
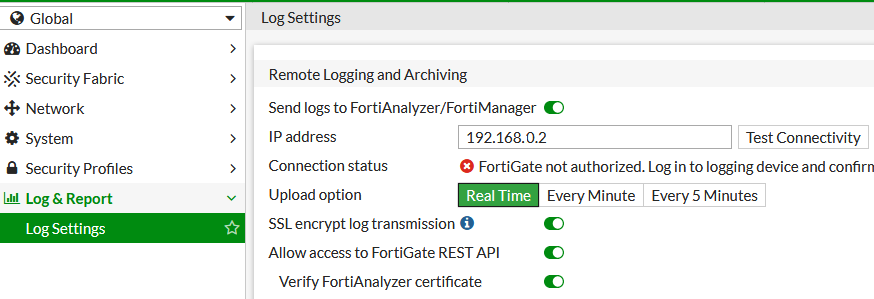
- In the Remote Logging and Archiving section, enable Send logs to FortiAnalyzer/FortiManager
We enter the IP address of the FortiAnalyzer and can test the Test Conenctivity, we should get the information that FortiGate is not authorized. We can change the log transmission to Real Time.
FortiAnalyzer Configuration
- Device Manager
Under Unauthorized Devices, we see our FW, which we authorize and assign a name.
FortiAnalyzer Upgrade
Documentation FortiAnalyzer 6.2.5 Upgrade Guide, FortiAnalyzer 6.2.5 Release Notes, FortiAnalyzer 6.4.0 Compatibility with FortiOS
The upgrade is described in detail in the official documentation, here are just the basic steps.
FortiAnalyzer Firmware Image for the upgrade is downloaded from the Fortinet Customer Service & Support website, in the Download - VM Images section. We select the FortiAnalyzer product, the Download tab, and navigate to the required version. For VMWare ESXi, it's a file starting with FAZ_VM64 with the .out extension, which is the upgrade file (64-bit firmware image to upgrade your existing FortiAnalyzer VM installation). The file name is typically FAZ_VM64-v6-build1307-FORTINET.out. The file with the .out.ovf.zip extension contains the package for a new VM installation (OVF and VMDK).
Preparation Steps
- Device Manager - check devices, that none are in Log Status Down state
- System Settings - Dashboard - check the system status, licenses, utilization
- System Settings - Dashboard - System Configuration - Backup
Upgrade
- System Settings - Dashboard - Firmware Version - Upgrade Firmware
- Select the firmware file and confirm OK
- The firmware package is immediately uploaded and the upgrade and restart are performed without further confirmation, the entire process takes a few minutes
Verification
- Log in to FortiAnalyzer
- System Settings - Event Log - check the logs
- After the upgrade, the DB rebuild may be in progress
There are no comments yet.